|
AeroAstro Magazine HighlightThe following article appears in the 2009–2010 issue of AeroAstro, the annual report/magazine of the MIT Aeronautics and Astronautics Department. © 2010 Massachusetts Institute of Technology. SPACE-BASED OBSERVATION PROGRAM IS KEY TO INFORMED CLIMATE CHANGE REMEDIATIONBy Daniel Selva, Brandon H. Suarez, and Edward F. Crawley
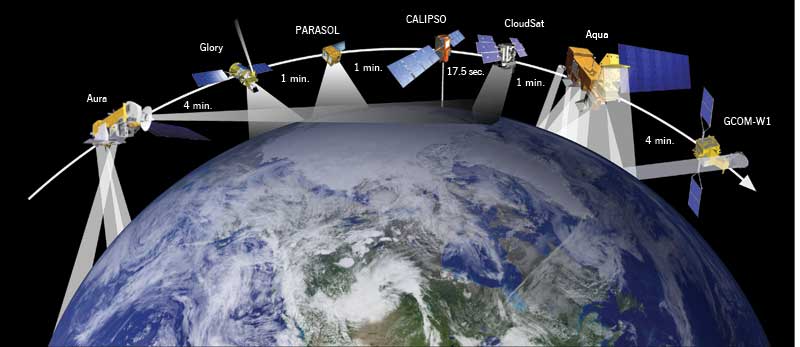
With the threat of climate change on the horizon and generating more public debate than ever, an MIT Aeronautics and Astronautics research group is architecting a system to monitor climate, perform Earth science research, and forecast weather for the United States. The Earth observation system will comprise a complex network of satellites working in conjunction with aircraft, weather balloons, and other observation platforms. As government agencies like NASA and the National Oceanic and Atmospheric Administration look to the future, they will make decisions to build new satellites and invest in new technology. The MIT Space System's Architecture Group is creating the tools and methodologies to inform these decisions and create a holistic system. DATA COLLECTION IS THE KEY TO CLIMATE CHANGE ACTIONThere is now evidence that if governments around the world take no action to combat climate change, the consequences of the increase in anthropogenic greenhouse gas emissions are likely to harm ecosystems, human health, and the world economy. Most governments now understand that this is a real problem that requires a response. Reducing global greenhouse gas emissions, and investing in energy efficiency and renewable energy technologies can offset some of the climate change impact. Yet, mitigating and adapting to the impacts of climate change will require investments that could prove unaffordable for many nations. Therefore, it is crucial to make the right decisions; that is, the most effective decisions in terms of societal benefits and lifecycle costs. A major factor undermining the decision-making process is the large uncertainty regarding both the economic and the scientific nature of the problem. Because of this, policy makers are reluctant to commit to action plans that could represent significant portions of their gross domestic products. To resolve this uncertainty, scientists need long series of high temporal and spatial resolution data as inputs into their climate models. The only system capable of providing this data is a large, coordinated model that includes weather balloons, aircraft, satellites, and a ground data network for data sharing and distribution. Improved and continued space-based observations and measurements of the Earth's atmosphere, land, oceans and ecosystems are essential to this endeavor. The unique nature of space-based measurements lies in their global coverage of the Earth including the poles, the oceans, and non-populated land. THE EARTH SCIENCE DECADAL SURVEYAt no point in the history of the U.S. Earth science program has its value to society been clearer than now. However, under the current tight budgetary conditions, the problem of designing a space-based Earth observation program that satisfies the needs of all the Earth science communities and other stakeholders is, indeed, challenging. This is why NASA and NOAA commissioned the National Research Council to conduct the Decadal (10-year) Survey as a means to provide recommendations for the implementation of next decade's Earth observation program. In 2007, after three years of deliberation, the National Research Council published a report summarizing the conclusions reached by an ad hoc committee of experts. In addition to general guidance and high-level recommendations, the report provides a detailed baseline architecture for a program consisting of 38 instruments flown in 17 missions to be launched between 2010 and 2020. The Decadal Survey baseline architecture was designed to satisfy the needs of all the Earth sciences disciplines under a set of assumptions. However, only three years after the NRC report's publication, many of the committee's assumptions are no longer valid. According to NASA sources and mission websites, mission cost estimates have grown, on average, by roughly a factor of two, while NASA's yearly budget has been almost halved. As a consequence, under current conditions, the baseline architecture would take almost four decades to launch. Furthermore, precursor missions that the committee assumed would be flown during the decade such as GPM, NPOESS, and OCO, have been delayed or even cancelled. It is obvious that alternative architectures need to be explored. The question we are asking is: can we do better than this baseline architecture under current assumptions? DEVELOPING STUDY METHODS AND TOOLS
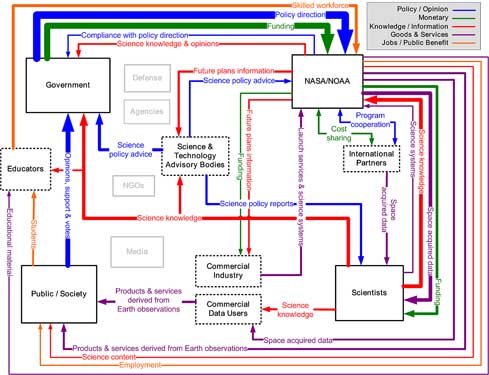
For the last three years, we in the Space Systems Architecture Group have been developing a set of tools and methods that can help answer this question: stakeholder networks, campaign-level science traceability matrices, a mission scheduling algorithm, and an instrument packaging algorithm. These tools encompass a broad variety of disciplines including remote sensing, space systems engineering, engineering economics, project management, risk and reliability analysis, system design optimization under uncertainty, and artificial intelligence. An outcome of a stakeholder analysis is a map in which all stakeholders — entities that put their assets at risk in the project — are represented as nodes and their relationships as arcs between these nodes. Based on the theory developed by Ed Crawley and Bruce Cameron (S.M. '07), and using data from a variety of sources including newspapers and transcripts from the hearings in the House of Representatives, Tim Sutherland (S.M. '09) created the stakeholder map for the NASA Earth Observation Program, which contains dozens of stakeholders and hundreds of flows. Thus, stakeholder analysis provides an assessment of the relative importance of different scientific disciplines represented by their corresponding "panels" in the Decadal Survey. The campaign-level science traceability matrix takes the output of the stakeholder analysis, a set of panel weights, and traces this value back into objectives, measurements, instruments and finally missions. Hence, this tool allows a systematic comparison of the relative importance of heterogeneous instruments and missions in the Decadal Survey. Based on careful reading of the NRC report and data from the NASA Goddard Space Flight Center, Theo Seher (S.M.'09) developed this simple and powerful tool, which has since been used to generate inputs for scheduling and packaging models.
The packaging tool takes a set of instruments as an input and explores different assignments of instruments into satellites. In other words, the tool compares architectures using small satellites carrying few instruments, with larger multi-instrument platforms. The flagship example of a large scientific observatory containing multiple instruments is the Envisat satellite. Because of scientific synergies among measurements, some of the instruments are great candidates for sharing a common satellite platform, thus achieving lifecycle cost reductions. Other instruments are less compatible for a variety of reasons such as electromagnetic, optical, mechanical, or thermal interference between instruments or very different technology maturity levels. All this is factored into this multidisciplinary tool developed by Ph.D. candidate Daniel Selva, which includes a complexity-based cost model, a schedule model based on Technology Readiness Levels, a risk model and a knowledge-based scientific model that embeds dozens of "synergy rules." Finally, the scheduling tool orders the launches of the proposed satellites so that constraints for the estimated yearly budget allocated to NASA for Earth Science missions and earliest launch dates for each instrument are not violated. The scheduling tool is key to study the data continuity problem, since under tight budgets it will determine which measurements are guaranteed continuity and which are not. Brandon Suarez (M.S. '11) has developed a scheduling algorithm based on a multi-objective genetic algorithm that allows identification of architectures optimizing value delivery across disciplines and minimizing data gaps under different scenarios.
This phenomenon, in which the departure throughput saturates when the number of departures on the surface exceeds a threshold, is characteristic of congested airports, and suggests that limiting the buildup of queues on the airport surface by controlling the pushback times of aircraft could be a relatively simple way of decreasing taxi times and emissions. Using simulations of Logan Airport, we have estimated that if this policy were in effect during the most congested times of operation, flights during these periods would experience nearly a 20 percent decrease in taxi-out times. This benefit arises because flights taxiing during periods when the surface traffic exceeds this threshold experience long taxi times. Of course, there are practical challenges to overcome to achieve these benefits, such as the availability of gates, ATC workload, tug coordination, and passenger movement. Additionally, airline competitiv factors such as on-time performance statistics, crew pay policies, and ground crew coordination pose significant challenges to surface movement optimization, and are being addressed in this project. As we go to press, we have just completed a reduced fuel burn and emissions demonstration at BOS, with the overall goal of initiating wider adoption of the methods throughout the United States. Early results from field tests, conducted between August 23 and September 23, 2010, show that during eight four-hour demonstration periods, more than 15,000 kg of fuel were saved, at the rate of 50-60 kg per gate-held flight. Moreover, these savings were achieved with average gate-hold times of only four minutes. The problem of coordinating airport surface operations presents a range of exciting intellectual challenges that include understanding the cognitive processes of air traffic controllers, modeling the dynamics of various flows (both physical ones consisting of aircraft, as well as information flows between various components) using surface surveillance data, developing algorithms that determine the control strategies, and trading off the objectives and incentives of multiple stakeholders. But these challenges are accompanied by the wonderful opportunity to tackle some of the most critical problems being faced by air transportation today, and to significantly decrease the environmental impacts of airport operations.
|
||||||||||||
|
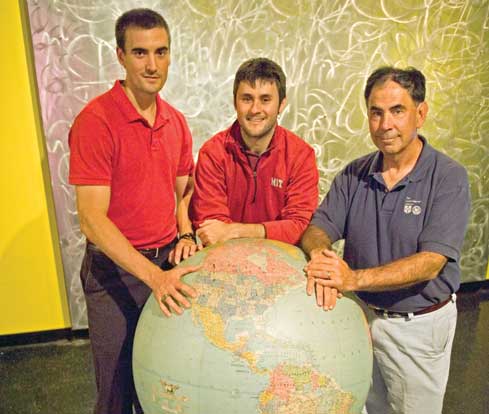
 Daniel Selva, an AeroAstro doctoral candidate, holds degrees in electrical engineering and aeronautical engineering from UPC in Barcelona and Supaero in Toulouse. Between 2004 and 2008, he worked in French Guiana as a member of the Ariane 5 Launch Team. Selva's research focuses on system architecture and remote sensing satellite systems for Earth observation. He may be reached at
  Brandon H. Suarez graduated from the AeroAstro 2009 and is working towards an M.S. degree. His graduate work is focused on the integration of aircraft and other non-space based observations into the Earth Observation System. Brandon also works for Aurora Flight Sciences where he designs and builds small unmanned aerial systems. He may be reached at
  Edward Crawley is the director of the Bernard M. Gordon - MIT Engineering Leadership Program and a former head of the MIT Aeronautics and Astronautics Department. He is a Ford Professor of Engineering with appointments in Aeronautics and Astronautics and in Engineering Systems. His research focuses on the domain of architecture, design, and decision support in complex technical systems. He may be reached at